

Canaries in the Phosphate-Toxicity Coal Mines
Lara Pizzorno, MDiv, MA, LMT
Abstract
Phosphorus is an essential mineral for cell structure and function but, when consumed in excess of the body’s requirements, has many adverse effects on metabolism and health. Recently published research has revealed that the average American consumes far more phosphorus than the recommended dietary allowance (RDA) (700 mg/d for adults). Some individuals’ daily phosphorus intake exceeds even an adult’s tolerable upper limit (4000 mg/d). Until now, understanding of the adverse effects caused by high phosphorus intake has come from patients with chronic kidney disease (CKD), in whom high levels of serum phosphates are strongly associated with increased cardiovascular and all-cause mortality. Due to their impaired renal function, CKD patients cannot clear excess phosphorus, for which reason they must avoid processed foods, virtually all of which are laden with phosphate-containing food additives. Recently, it has become apparent that CKD patients are our canaries in the phosphate-toxicity coal mines. Excessive phosphorus consumption has now been shown to be clearly associated with cardiovascular disease, osteoporosis, and all-cause mortality in the general, healthy population.
Lara Pizzorno, MDiv, MA, LMT, is a senior medical writer and editor with Integrative Medicine Advisors, LLC, in Seattle, Washington.
Corresponding author: Lara Pizzorno, MDiv, MA, LMT E-mail address: laraup@salugenecists.com
Chang et al1 recently published the results of their investigation into the association between excessive phosphorus intake and mortality in a prospective cohort of healthy adults in the United States. Their findings revealed that current levels of phosphorus in the US food supply are shockingly high, that excessive phosphorus intake is common, and that it is strongly associated with increased mortality, not only in individuals with kidney disease but also in the general population with healthy renal function.
Study participants—drawn from the National Health and Nutrition Examination Survey III (NHANES III, 1988–1994), a nationally representative sample of the civilian, noninstitutionalized US population—were 9686 nonpregnant adults aged 20 to 80 years, without diabetes, cancer, or kidney or cardiovascular disease. Exposure to dietary phosphorus was assessed using a 24-hour dietary recall, which likely underestimated daily intake by 25% to 30% because of issues discussed in the present article.
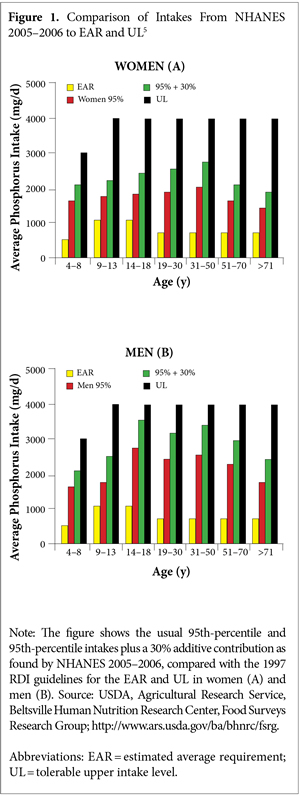
For phosphorus intake, the estimated average requirement (EAR) is 580 mg/d, and the recommended daily allowance (RDA) is 700 mg/d.2 In the 2005 to 2006 NHANES, median phosphorus intake was 1166 mg/d; median phosphorus density, milligrams of phosphorus consumed per kilocalorie (mg/kcal), was 0.58. Further research in 2009, also using data from the 2005 to 2006 NHANES, found that Americans’ daily intake of phosphorus had continued to increase and was far in excess of the guidelines for US dietary reference intake (DRI) (ie, the EAR and RDA) for men and women aged 19 years or older.3 More than one-half of young and middle-aged men consumed 1600 mg/d of phosphorus or more. Comparably aged women consumed almost 1200 mg/d.
Disruption of Phosphorus Homeostasis
Numerous studies have now shown that phosphate intakes in excess of the nutritional needs of the healthy population can significantly disrupt hormonal regulation of phosphorus, calcium, and vitamin D, causing (1) disordered mineral metabolism; (2) osteoporosis (ie, impaired peak bone mass, excessive bone resorption, and increased risk of fracture); (3) cardiovascular disease (ie, vascular calcification); and (4) impaired kidney function and renal disease.
In healthy individuals, elevation of extracellular phosphorus caused by excessive phosphorus intake is the main stimulus disrupting phosphorus homeostasis, as it is in chronic kidney disease (CKD) patients, even when phosphorus intake is modest.4
Large epidemiological studies provide evidence that even mild elevations of serum phosphorus within the normal range are associated with increased cardiovascular disease risk in healthy populations with no evidence of kidney disease.1,5,6
Disruption of Mineral Metabolism
Adding fuel to the phosphorus fire, not only are most Americans consuming significantly more phosphorus daily than the amount recommended by both DRI guidelines, but also daily calcium intake often fails to meet recommendations. Dietary guidelines recommend that calcium and phosphorus be consumed in a 1:1 molar intake ratio or even a 1.5:1 mass intake ratio of calcium to phosphorus. In reality, the calcium-to-phosphorus (Ca:P) ratio in the typical US diet is far below these recommended guidelines. According to NHANES 2009 to 2010 data, these ratios are less than 0.6 for 25% of the US population. In animal studies, mass intake ratios of less than 0.5 have been shown to cause bone loss, even when calcium intake was considered adequate.7
This shift away from the recommended Ca:P intake ratio, optimally 1.5:1, further promotes dysfunctional mineral metabolism, increasing not only adverse effects on bone, cardiovascular, and renal health, but also on all-cause mortality. In the analyses of Chang et al,1 which were adjusted for demographics, cardiovascular risk factors, kidney function, and energy intake, higher phosphorus intake was associated with higher all-cause mortality in individuals who consumed >1400 mg/d, (adjusted hazard ratio of 2.23). As noted above, the 2005 to 2006 NHANES found that more than one-half of young and middle-aged men were consuming 1600 mg/d of phosphorus or more, putting them at higher risk.
When phosphorus density was >0.35 mg/kcal, a similar association was seen between higher phosphorus density (ie, mg of phosphorus consumed per kcal, and all-cause mortality, with an adjusted hazard ratio of 2.27). Phosphorus density of >0.35 mg/kcal was also strongly associated with cardiovascular mortality, with an adjusted hazard ratio of 3.39. Even data from NHANES III, which for reasons discussed herein underestimates actual phosphorus intake significantly, calculated median US phosphorus density at 0.58 mg/kcal.1
Processed Food Consumption Drives Excessive Intake
Already present in most foods as a natural component, phosphorus is also extensively used as a generally recognized as safe (GRAS) ingredient added during food processing. Consumption of processed foods has continued to increase over the past several decades in the United States and globally in our modern world. Phosphorus intake has increased concomitantly.8
Phosphorus intakes estimated from the NHANES from 2001–2002 to 2009–2010 show a 90-mg/d increase in phosphorus intake for men and a 64-mg/d increase for women. What is most alarming is that even though the NHANESs reveal median intakes of phosphorus that far exceed the EAR for all age and gender groups (with the exception of rapidly growing adolescents), because manufacturers are not required to specify how much phosphorus they have added, the NHANES data do not accurately reflect the contribution of phosphorus-containing additives in processed foods. In actuality, significantly greater intakes of phosphorus than those calculated in the NHANES are occurring.
Phosphorus-containing additives are used as processing aids with many different functions, including leavening, color and moisture retention, anticaking, and flavor enhancement. Their increasing cumulative use has been quite dramatic.2 In any average person’s refrigerator, freezer, and pantry, the majority of processed food products contain phosphorus, often in numerous GRAS additives. The amount of phosphorus in each additive and each food may be low, but the total phosphorus load each day can add up.6
Although, in some cases, manufacturers disclose how much phosphorus they have added, this is not typically done because disclosure is not required, so it is impossible to accurately estimate how much phosphorus we are consuming via food additives. Current databases, including those based on the recently updated United States Department of Agriculture (USDA) Nutrient Content Database, are conservatively thought to underestimate the phosphorus content of processed foods by at least 25% to 30%.2 What we do know with certainty is that the impact of intake exposure to phosphate-containing additives is far from trivial.
When researchers evaluated the phosphorus content of only 1 frequently purchased category of convenience foods in Midwestern grocery stores—fresh-frozen chicken products—direct chemical analyses found that the majority of products contained at least 1 and often several phosphorus-containing ingredients, contributing an average of 84 mg of phosphorus per 100-g (~3- oz) serving.9 And few individuals consume only 3 oz of chicken, an amount smaller than a deck of cards.
Similar analyses of other meat and poultry products found from 6.1 to 21.5 mg of added phosphorus per gram of protein. Approximately 30% of poultry, 15% of beef, and 90% of pork are enhanced by being injected with some type of liquid solution to increase the meat’s volume and to “replace the flavor and moisture loss that results from raising leaner animals or from potential overcooking,” according to the American Meat Institute.10 Enhanced meat products, which have previously not been reported in the USDA’s nutrient database, were found to have a 28.4% higher phosphorus-to-protein ratio than natural meat products.4
Analyses of cooked ham, turkey, and chicken with phosphate additives declared on the label reported a phosphorus content nearly 70% higher than similar products without additives, contributing, on average, >100 mg of added phosphorus per 100 g (~3 oz) of protein. 4 Three ounces of protein is smaller than a typical serving size for most adults, teenagers, and even children aged 10 years or older.
Increased Bioavailability in Food Additives
Not only are phosphorus-containing food additives ballooning Americans’ phosphorus consumption, but when delivered via food additives, phosphorus is far better absorbed than that naturally present in food. For this reason, even if we had an accurate assessment of Americans’ dietary phosphorus intake, we would still have only a poor estimate of how much phosphate is circulating in the average American’s bloodstream. Reasons for the challenges in measuring blood levels of phosphorus are discussed in detail later in the present article.
Phosphorus contained in plant-protein sources, such as soy or whole grains, is present mostly as phytate, which is the principal storage form of phosphorus in many plant tissues. Phytate requires enzymatic release and, therefore, is not as easily digested and absorbed as the phosphorus in animal protein sources, such as meat. But even in natural meat products, phosphorus is bound to protein and other nutrients, so it is absorbed slowly and inefficiently. In contrast, phosphorus in food additives is not part of the food matrix and is rapidly and almost completely absorbed.
The organic phosphorus consumed in whole foods in a mixed diet is absorbed with a 60% average rate of efficiency. At this rate, healthy adults’ kidneys can excrete an amount of phosphorus equal to that consumed in a 24-hour period, thus maintaining blood concentrations of phosphorus within a tight, and safe, range. Inorganic phosphorus in food additives, such as the phosphoric acid used in a wide array of products, ranging from carbonated beverages to commercial salad dressings, has an absorption efficiency approaching or equal to 100%.4
If we continue to consume a diet high in animal protein and rely increasingly on processed foods, phosphorus intake will not only continue to remain far higher than can be adequately excreted by healthy kidneys, but will increase. And consumption of highly processed, convenience foods—which depend on the numerous functional properties of phosphorus-containing additives to achieve desired outcomes, such as texture or water retention—is increasing, not only in the United States but worldwide, particularly in the United Kingdom, where the use of phosphorus-containing food additives is already extensive.1 Commonly used dietary supplements and over-the-counter and prescription medications also contain phosphate additives. The average phosphorus content of the 165 multivitamin and mineral supplements consumed by men and women in the 2007 to 2008 NHANES was 108 mg per daily dose, and the total phosphorus contribution ranged from 31 to 130 mg/d. Data are lacking on the phosphorus content of many commonly prescribed medications, but some medications are known to contain them. For example, all of the following medications contain some form of calcium phosphate, in unknown amounts: Norvasc, Metolazone, Catapress, Ziac, Amiloride, Zestril, Zebeta, Micronase, Januvia, Prandin, Diabeta, Tums, Crestor, Vicodin, Viagra, and Zoloft. Some patients take several of these medications daily,2 with unknown impact on phosphorous metabolism.
Mechanisms by Which Excessive Phosphate Intake Exerts Adverse Effects Promotion of Metabolic Acidosis
 Whether inorganic or organic in origin, dietary phosphorus, animal protein, and salt are common contributors to acid load in the Western diet.1,4 In nature, phosphorus is always bound to oxygen, which makes it highly acidic, and this fact is a key reason why diets high in animal protein promote metabolic acidosis. However, the acid-generating capacity of diets high in animal protein and their impact on bone loss and on cardiovascular and kidney disease remain controversial. Recent studies suggest positive anabolic, or at least no negative, effects on bone from dairy protein, which is high in calcium, but a catabolic effect for animal protein lacking in calcium.
A recent review of Framingham data supports this hypothesis.11 The researchers reviewed data collected on 1752 men and 1972 women who had participated in the Framingham offspring study. These participants were middle-aged individuals who filled out a baseline food-frequency questionnaire from 1991 to 1995 or from 1995 to 1998 and were followed for occurrence of hip fracture until 2005. Those with calcium intakes of less than 800 mg/d, who were also consuming the most animal protein, had 2.8 times the risk of hip fracture compared with those consuming the least animal protein. In contrast, those who were consuming at least 800 mg/d of calcium and were also consuming the most animal protein had an 85% reduced risk of hip fracture.11
The takeaway appears to be that those who regularly eat meat should consume at least 800 mg/d of calcium. Actually, the calcium RDI for women and men older than 19 years is 1200 mg/d, and for postmenopausal women not on hormone replacement, 1500 mg/d. And for those not allergic to the protein in cow’s milk, organic dairy foods from pastured animals may be recommended as a means of consuming adequate calcium. The rich supply of calcium provided by dairy foods, rich in animal protein, helps offset their tendency to promote metabolic acidosis.
Hormonal Dysregulation
Spikes or even transient increases in serum phosphorus due to excessive intake can trigger changes in the secretion of parathyroid hormone (PTH) and fibroblast growth factor (FGF-23), both of which are critical to the endocrine regulation of extracellular phosphorus.
High phosphorus intake stimulates the secretion of PTH, which promotes renal synthesis of the most active form of vitamin D—1,25-dihydroxyvitamin D3 or calcitriol—but also increases osteoclast activity, thus causing excessive bone resorption when chronically elevated.1
The most recent studies show that phosphorus intake in excess of nutrient needs also disrupts hormonal regulation of calcium and vitamin D via the effects FGF-23, a recently recognized hormone secreted by osteocytes, (what osteoblasts become in bone once they begin forming the bone matrix).1,4,7,8 Dietary phosphorus loading promotes osteocytes’ secretion of FGF-23, which strongly inhibits the kidneys’ synthesis of calcitriol. Excessive secretion of FGF-23 has been found to significantly contribute to bone loss and cardiovascular and renal disease.
The combined actions of PTH and FGF-23—increased bone breakdown plus greatly impaired ability to absorb calcium—not only result in bone loss, but are well known to cause adverse cardiovascular effects, such as arterial calcification, endothelial dysfunction, and left ventricular hypertrophy.7 A high-phosphorus diet promotes the transformation of contractile, vascular, smooth-muscle cells to a bone-forming phenotype, which calcifies the vasculature while simultaneously promoting the loss of mineral from bone, a process called osteochondrogenic differentiation.12
A number of animal studies have shown that high dietary phosphorus relative to calcium intake induces secondary hyperparathyroidism, bone resorption, lower peak bone mass, and fragile bones in young and old animals.7 Several acute studies in healthy adult humans have shown that, even in healthy subjects, oral phosphate loading increases levels of markers of cardiovascular disease (ie, a high ankle-brachial index, which is a hallmark of peripheral arterial stiffness). A serum-phosphate level of 4.0 mg/dL is associated with a 4-fold greater risk of a high ankle–brachial index13 and of bone loss, as indicated by increased levels of serum cross-linked C-telopeptides (CTx) and urinary cross-linked N-telopeptides (NTx).7,12
Dysfunctional secretion of PTH and FGF-23 provoked by high dietary phosphorus is now considered a key factor in progressive bone loss with age, especially when calcium intake is low, as it is for the majority of Americans. Data from the 1999 to 2002 NHANES, including both food and supplements, indicated that at least 60% of Americans were not getting enough calcium to meet current recommendations.14 And this situation has not improved. A 2010 analysis of the 2005 to 2006 NHANES data studied calcium intake not only from food and supplements but also from antacids, which would be expected to have limited impact on bioavailable calcium because calcium must be solubilized by stomach acid before it is able to be absorbed. The study found that although 43% of Americans used calcium supplements (2003–2006) and 37% used vitamin D supplements (2005–2006), even among users of dietary supplements, the adequate intake (AI) recommendation for calcium was met by only approximately 12% of those aged 71 years or older.15 This state of affairs is also dismal in the United Kingdom, where mean intake of calcium among women aged 50 to 64 years is 823 mg, well below the AI of 1200 to 1500 mg.16
Dysregulation of any of the 3 hormones—calcitriol, FGF-23, or PTH—has been shown to promote both bone and heart disease, even when serum phosphorus is in the normal range.1
Normal Serum Phosphorus Levels Do Not Provide Accurate Assessment of Risk. A high dietary phosphorus intake may induce disease in healthy individuals even without a measurable elevation within the normal range of fasting serum phosphate because serum phosphorus concentrations are tightly regulated by PTH and FGF-23, and the concentration of phosphorus in serum follows a pronounced circadian rhythm.8
Serum Phosphorus Concentrations Are Tightly Regulated by PTH and FGF-23. Even in the absence of high serum phosphate concentrations, excessive dietary phosphorus intake may be causing harm.17 Serum-phosphorus concentrations are tightly regulated by PTH and FGF-23, both of which increase urinary phosphorus excretion. Individuals with normal kidney function will maintain serum phosphorus in a physiologic range, despite consuming >700 mg/d of phosphorus, because increased phosphorus consumption leads to physiologic increases in PTH and FGF-23. Over the long term, however, high FGF-23 concentrations promote left ventricular hypertrophy,18 and high concentrations of both PTH and FGF-23 have been repeatedly linked with heart failure, cardiovascular events, progression of CKD, and mortality.19,20
Pronounced Circadian Fluctuation in Serum Phosphorus Concentration. A second factor causing a lack of correlation between a fasting, morning serum-phosphorus concentration and dietary intake of phosphorus is the pronounced circadian variation in serum phosphorus concentration over a 24-hour period. A similar biphasic pattern of this circadian rhythm occurs for both serum phosphorus and its regulating hormone, PTH.
The highest peaks in serum phosphorus occur in the very early morning hours, independent of diet. Serum phosphorus has an early morning nadir between 8:00 AM and 10:00 AM, when blood for routine analysis is usually drawn, and postprandial and nighttime peaks (between 2:00 AM and 4:00 AM).17 Even if recent dietary phosphorus intake has significantly increased, serum phosphorus will revert to its previous morning fasting concentration. This is another reason why, as morning fasting blood samples are the norm, the relationship between intake and serum-phosphorus concentration has been missed. Multiple blood samples taken over a 24-hour period are required to accurately assess the amount of phosphorus that has been in an individual’s systemic circulation in the course of a day.
The PTH story is different. Unlike serum phosphorus, which retains a biphasic diurnal variation despite higher intakes of phosphorus, PTH loses its biphasic pattern, remaining persistently elevated with prolonged high phosphorus, low calcium intakes (Ca:P-mg intake ratio <0.3). PTH is acutely elevated in response to oral phosphate loading; is persistently elevated in response to weeks of consuming grocery foods that are high in phosphate additives, which are common and abundant in the standard American diet (SAD); and has been shown to be significantly higher in young women whose habitual diets have Ca:P ratios of less than 0.6.7
Dietary Choices that Lower Phosphate Intake
A more ideal diet would consist primarily of organic, locally grown, whole foods, mainly (1) low glycemic-load vegetables, legumes, nuts, and seeds; (2) wild-caught, omega-3-rich fish; (3) free-range eggs; (4) extra-virgin olive oil; and (5) meat and dairy products from pastured animals. All should be minimally processed, prepared at home, and liberally seasoned with herbs but only minimal amounts of salt. The reality for the majority of Americans, and most likely the majority of your patients, is that processed, convenience foods constitute a significant portion of the diet.
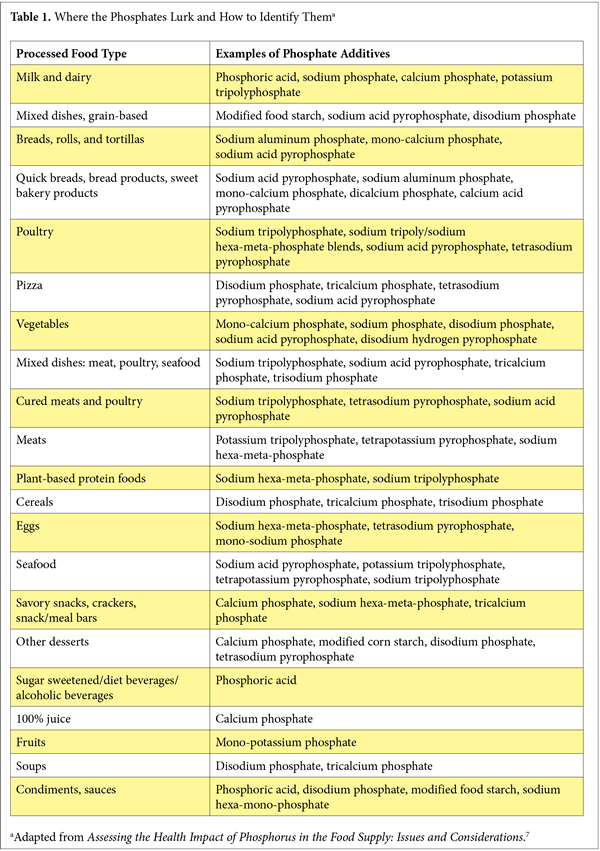
What can you do to help your patients lower their risks of excess phosphate consumption? Encourage avoidance of the most phosphate-laden offenders: cola drinks and the convenience foods highest in phosphate additives. See Table 1.
Avoid Soft Drinks, Especially Cola
Cola drinks top the phosphate delivery hit list. Even disregarding the impact on blood sugar regulation and inflammation, cola drinks are in a class by themselves because of their total lack of potentially mitigating minerals (eg, calcium and magnesium) accompanying the hefty dose of phosphorus, and because colas, unlike most other soft drinks, contain an 100% bioavailable form of phosphorus, phosphoric acid (H3PO4), which is rapidly absorbed. Colas are often consumed without food, further increasing their potential for producing spikes in serum phosphate.7
The rapidity with which cola drinks exert harmful effects, especially in the absence of adequate dietary calcium, has been demonstrated in young men.21 In a randomized, crossover trial, Kristensen et al21 examined the short-term effects on bone turnover of replacing milk with cola beverages. For two 10-day periods, separated by a 10-day washout period, they gave 11 healthy young men, aged 22 to 29 years, either 2.5 L (~2.75 qt) of cola or 2.5 L of skimmed milk per day. The young men ate the same basic diet during each period. During the cola period, their calcium and phosphorus intakes were 470 and 1690 mg/d, respectively. During the milk period, their calcium and phosphorus intakes were 3500 and 3640 mg/d, respectively. Within only 10 days of drinking cola, significant increases of the following were seen in the young men’s blood levels: (1) phosphate, (2) parathyroid hormone, (3) markers of bone turnover (osteocalcin) and resorption (serum cross-linked CTx and urinary cross-linked NTx), and (4) calcitriol (1,25[OH]2D, the hormonally active form of vitamin D). None of these adverse effects were seen when milk was consumed.
The negative impact of cola, specifically, versus intake of other sodas, has also been noted on older adults’ bone status. In the Framingham Osteoporosis Study, the mean hip bone mineral density (BMD) of postmenopausal women consuming 1 cola drink or more daily was 4% to 5% lower than the average hip BMD of those who consumed less than 1 serving of cola per month, and no association with BMD was seen for cola-free soft drinks. The association followed a strong dose response and was consistent across all types of cola: total, regular, decaffeinated, and diet.22
Sleuthing the Phosphates
Phosphorus additives are added to convenience and processed foods for purposes of flavor and texture enhancement; they are present in most of the best-selling grocery convenience foods: prepared frozen foods, dry food mixes, packaged meats, breads and baked goods, soups, yogurts, carbonated beverages, frozen vegetables, shelf-stable juice drinks, ready-to-serve foods, snacks, cheese, condiments, and sauces.23 Food-labeling regulations do not require reporting of phosphorus content on nutrition-facts labels, so minimizing intake of phosphorus additives means reading the small print in nutrition-facts boxes and choosing prepared foods with the fewest additives. Better yet, advise your patients to purchase and consume whole, minimally processed, additive-free foods.
Clinical Indicators and Labs for Assessment of Hyperphosphatemia
Excessive phosphate consumption should be considered as a possible contributing factor in patients presenting with hypertension, arteriosclerosis, coronary artery disease, history of myocardial infarction or stroke, osteopenia, osteoporosis, and impaired kidney function or other form of kidney disease. Of special concern are patients in the early stages of compromised kidney function, who may not be aware of their need to avoid phosphate additives.
Hypertension, particularly high systolic blood pressure, may be a strong indicator of phosphate toxicity. As mentioned above, a high-phosphorus diet is a key factor in promoting osteochondrogenic differentiation, the transformation of contractile, vascular, smooth-muscle cells to a bone-forming phenotype, which calcifies the vasculature while simultaneously promoting loss of mineral from bone.12
For this reason, a high ankle-brachial index, a hallmark of peripheral arterial stiffness, may indicate excessive phosphate intake.13 In healthy individuals, decreased flow-mediated vasodilatation is suggestive of hyperphosphatemia because acute hyperphosphatemia causes acute impairment in endothelial function. A serum-phosphate level of 4.0 mg/dL is associated with a 4-fold greater risk of a high ankle–brachial index.
A 3- to 5-day food diary revealing frequent consumption of processed foods of any type, particularly soft drinks, prepared meats, frozen foods, or bread products, can help confirm a clinical diagnosis of risk sufficient to validate ordering 1 or more of the following laboratory tests.5
Lab Tests for Phosphate Toxicity
Urinary Cyclic AMP. Urine adenosine 3’,5’-monophosphate (cAMP) provides an in vivo receptor assay for the biologically active PTH and, thus, can serve as an indicator of hyperparathyroidism.24-26
Serum Phosphorus. As discussed previously, a circadian design using multiple blood samplings over at least 8 hours is required to accurately assess serum phosphate concentrations. The usual morning blood sample will not accurately reflect dietary phosphate burden.
Serum 25(OH)D and 1,25D. Elevated serum phosphate has an inhibitory effect on the renal activation of 25(OH)D to its active metabolite 1,25D. Lower concentrations of 1,25D have been associated with adverse cardiovascular outcomes.4
Serum Cross-linked CTx or Urinary Cross-linked NTx. These tests measure breakdown products of bone. High levels of analytes are indicative of bone loss.27-29
The NTx test reflects bone resorption by cathepsin K, an enzyme expressed by osteoclasts or by matrix metalloproteinase (MMP), a family of enzymes involved in tissue remodeling. NTx can be measured in either urine or serum, but measurement in serum is recommended. Although NTx levels do fluctuate in response to bone resorption, such measurements are problematic because they can vary spontaneously, particularly in urine, dropping as much as 50% from day to day with no treatment. To help correct for this fluctuation, ask for samples to be run on several days and request the serum rather than the urine NTx test.27
The CTx or C-terminal telopeptide test (ie, the test for carboxy-terminal collagen cross -links) measures a specific, crosslink peptide sequence of type 1 collagen that is found in bone, the portion cleaved by osteoclasts during bone resorption. Serum levels of this peptide sequence are proportional to osteoclastic activity at the time the blood sample is drawn. The test used to detect the CTx marker is called the Serum CrossLaps, and current research indicates that it is more specific to bone resorption than other currently available tests.
Initially, urinary levels of CTx were measured, but this testing was found to be no more reliable than urinary NTx values; both tests suffered from large spontaneous fluctuations unrelated to therapy or intervention. In contrast, the newer serum test for CTx levels shows minimal spontaneous disruption and high accuracy. Research comparing tests for CTx with those for NTx and deoxypyridinoline has found CTx testing to be the most accurate.7,27,30,31
Serum Intact PTH. Serum intact PTH (iPTH) is elevated in response to excessive phosphorus consumption and is recognized as a key mechanism through which hyperphosphatemia causes bone loss. Confirm this test with a test of serum-ionized calcium, the metabolically active portion of calcium not bound to protein in the bloodstream. If ionized calcium is at the high end of normal or above, iPTH should be low. If it is not, a high likelihood exists of hyperparathyroidism.32
Serum FGF-23. Serum FGF-23 is also elevated in response to excessive phosphorus consumption and inhibits renal synthesis of 1,25D from 25(OH)D. Confirm phosphate toxicity with serum 1,25D. If 1,25D is low, particularly if serum 25(OH)D levels are adequate, this result is further evidence of hyperphosphatemia. Serum FGF-23 and 1,25D can also be used to confirm patients’ compliance with dietary-phosphorus restriction as compliance will decrease FGF-23 and increase renal synthesis of 1,25D.12
High dietary phosphorus can induce disease even without a measurable elevation within normal range of fasting serum phosphate by disrupting the endocrine regulation of calcium and phosphorus. Calcium, a nutrient for which most Americans fail to meet the RDI, affects endocrine regulation of serum phosphate and reactions to phosphorus intake. Calcium and phosphorus need to be in optimal balance (1.5:1, mg:mg) to avoid disrupting their hormonal regulation. Americans’ high- phosphorus, inadequate-calcium diet induces the release of PTH and FGF-23 from bone. If perpetually elevated, both PTH and FGF-23 can exert significant, pathogenic, cardiovascular effects, such as arterial calcification, endothelial dysfunction, and left ventricular hypertrophy as well as bone loss. FGF-23’s inhibition of the kidneys’ activation of vitamin D may also help explain the strong associations found between low 1,25D, only one of the harmful effects of excessive phosphorus consumption, and cancer.33
Given that a direct relationship has now been established between high dietary phosphorus intake and all-cause mortality in healthy people, patients, particularly those with or at risk of cardiovascular disease or osteoporosis as well as those with or at risk of kidney disease or cancer, should be counseled to minimize consumption of processed foods, especially soft drinks. Current databases should be updated, and food manufacturers should be required to list the phosphorus content of processed foods on the nutrition facts panel.
Conclusion
As consumption of processed foods has increased over the past decades in the United States, so has consumption of phosphorus, which now far exceeds the nutrition requirement of most men and women. Overconsumption is reported by current databases, even though they underestimate the phosphorus content of foods by 25% to 30% because they do not capture phosphorus content from the ever-increasing use of phosphorus -containing food additives. In addition, phosphorus in food additives is rapidly and almost completely absorbed, whereas food-bound phosphorus is much more slowly and less efficiently absorbed.
It is now known that the greatly increased risk of cardiovascular disease, bone loss, and all cause-mortality resulting from high phosphorus intake affects not only CKD patients, whose impaired renal function renders processed foods a source of phosphate toxicity, but also the general population with healthy kidneys. Normal kidneys quickly clear excessive serum phosphate and maintain constant serum concentrations despite wide variations in dietary phosphorus intakes, so fasting serum phosphate, the variable usually measured, is not an accurate indicator of dietary phosphorus intake.
References
1. Chang AR, Lazo M, Appel LJ, Gutiérrez OM, Grams ME. High dietary phosphorus intake is associated with all-cause mortality: results from NHANES III. Am J Clin Nutr. 2014;99(2):320-327.
2. Calvo MS, Uribarri J. Contributions to total phosphorus intake: all sources considered. Semin Dial. 2013;26(1):54-61.
3. Moshfegh A, Goldman J, Ahuja J, Rhodes D, LaComb R. What We Eat in America, NHANES 2005-2006: Usual Nutrient Intakes from Food and Water Compared to 1997 Dietary Reference Intakes for Vitamin D, Calcium, Phosphorus, and Magnesium. Beltsville, MD: US Department of Agriculture, Agricultural Research Service; 2009.
4. Calvo MS, Tucker KL. Is phosphorus intake that exceeds dietary requirements a risk factor in bone health? Ann N Y Acad Sci. October 2013;1301:29-35.
5. Calvo MS, Uribarri J. Public health impact of dietary phosphorus excess on bone and cardiovascular health in the general population. Am J Clin Nutr. 2013;98(1):6-15.
6. Uribarri J, Calvo MS. Dietary phosphorus excess: a risk factor in chronic bone, kidney, and cardiovascular disease? Adv Nutr. 2013;4(5):542-544.
7. Calvo MS, Moshfegh AJ, Tucker KL. Assessing the health impact of phosphorus in the food supply: issues and considerations. Adv Nutr. 2014;5(1):104-113.
8. Uribarri J, Calvo MS. Dietary phosphorus intake and health. Am J Clin Nutr. 2014;99(2):247-248.
9. Sullivan CM, Leon JB, Sehgal AR. Phosphorus-containing food additives and the accuracy of nutrient databases: implications for renal patients. J Ren Nutr. 2007;17(5):350-354.
10. American Meat Institute. Meat matters: consumer’s guide to enhanced meats. http://www.meatmattersinfo.org/ht/a/GetDocumentAction/i/8685. Published October 2007. Accessed September 29, 2014.
11. Sahni S, Cupples LA, McLean RR, et al. Protective effect of high protein and calcium intake on the risk of hip fracture in the Framingham offspring cohort. J Bone Miner Res. 2010;25(12):2770-2776.
12. Menon MC, Ix JH. Dietary phosphorus, serum phosphorus, and cardiovascular disease. Ann N Y Acad Sci. October 2013;1301:21-26.
13. Kendrick J, Kestenbaum B, Chonchol M. Phosphate and cardiovascular disease. Adv Chronic Kidney Dis. 2011;18(2):113-119.
14. Ma J, Johns RA, Stafford RS. Americans are not meeting current calcium recommendations. Am J Clin Nutr. 2007;85(5):1361-1366.
15. Bailey RL, Dodd KW, Goldman JA, et al. Estimation of total usual calcium and vitamin D intakes in the United States. J Nutr. 2010;140(4):817-822.
16. Henderson L, Irving K, Gregory J. Vitamin and Mineral Intake and Urinary Analytes. London, United Kingdom: Her Majesty’s Stationery Office; 2003. The National Diet & Nutrition Survey: Adults Aged 19 to 64 Years; vol 3.
17. Gonzalez-Parra E, Tuñón J, Egido J, Ortiz A. Phosphate: a stealthier killer than previously thought? Cardiovasc Pathol. 2012;21(5):372-381.
18. Faul C, Amaral AP, Oskouei B, et al. FGF23 induces left ventricular hypertrophy. J Clin Invest. 2011;121(11):4393-4408.
19. Palomino HL, Rifkin DE, Anderson C, Criqui MH, Whooley MA, Ix JH. 24-hour urine phosphorus excretion and mortality and cardiovascular events. Clin J Am Soc Nephrol. 2013;8(7):1202-1210.
20. Naves-Díaz M, Passlick-Deetjen J, Guinsburg A, et al. Calcium, phosphorus, PTH and death rates in a large sample of dialysis patients from Latin America: the CORES study. Nephrol Dial Transplant. 2011;26(6):1938-1947.
21. Kristensen M, Jensen M, Kudsk J, Henriksen M, Mølgaard C. Short-term effects on bone turnover of replacing milk with cola beverages: a 10-day interventional study in young men. Osteoporos Int. 2005;16(12):1803-1808.
22. Tucker KL, Morita K, Qiao N, Hannan MT, Cupples LA, Kiel DP. Colas, but not other carbonated beverages, are associated with low bone mineral density in older women: the Framingham Osteoporosis Study. Am J Clin Nutr. 2006;84(4):936-942.
23. León JB, Sullivan CM, Sehgal AR. The prevalence of phosphorus-containing food additives in top-selling foods in grocery stores. J Ren Nutr. 2013;23(4):265-270.e2.
24. Thode J. Ionized calcium and cyclic AMP in plasma and urine: biochemical evaluation in calcium metabolic disease. Scand J Clin Lab Invest Suppl. 1990;197:1-45.
25. Test ID: GRP: cyclic AMP, urinary excretion. Mayo Medical Laboratories Web site. http://www.mayomedicallaboratories.com/test-catalog/ Clinical+and+Interpretive/8771. Accessed July 1, 2014.
26. Information on cyclic AMP (adenosine monophosphate urine test. Medical Health Tests Web site. http://www.medicalhealthtests.com/pathology-test/ cyclic-amp-urine-test.html. Accessed July 1, 2014.
27. Huber F, Traber L, Roth HJ, Heckel V, Schmidt-Gayk H. Markers of bone resorption--measurement in serum, plasma or urine? Clin Lab. 2003;49(5-6):203-207.
28. Biver E, Chopin F, Coiffier G, et al. Bone turnover markers for osteoporotic status assessment? A systematic review of the diagnosis value at baseline in osteoporosis. Joint Bone Spine. 2012;79(1):20-25.
29. Biver E. Use of bone turnover markers in clinical practice. Curr Opin Endocrinol Diabetes Obes. 2012;19(6):468-473.
30. Hamano T. Bone and bone related biochemical examinations: bone and collagen related metabolites: urinary and serum NTX as bone resorption markers [in Japanese]. Clin Calcium. 2006;16(6):987-992.
31. Ju HS, Leung S, Brown B, et al. Comparison of analytical performance and biological variability of three bone resorption assays. Clin Chem. 1997;43(9):1570-1576.
32. Ong GS, Walsh JP, Stuckey BG, et al. The importance of measuring ionized calcium in characterizing calcium status and diagnosing primary hyperparathyroidism. J Clin Endocrinol Metab. 2012;97(9):3138-3145.
33. Welsh J. Cellular and molecular effects of vitamin D on carcinogenesis. Arch Biochem Biophys. 2012;523(1):107-114.
All rights reserved. Terms and Conditions.